Sophisticated dashboards to showcase your success story and campaign ROI
Monitor the reach of your message
With our personalized dashboard and reporting, you get up-to-the-minute intel about where your content is published, how many clicks it gets and so much more. Our deep reporting shows you exactly who, what, where, when and how, with hard numbers, links and metrics.
This way, you’re fully prepared to report back to your clients and stakeholders exactly how you performed and what these metrics mean for your campaign’s success.
Distribution metrics
Metrics that we provide include:
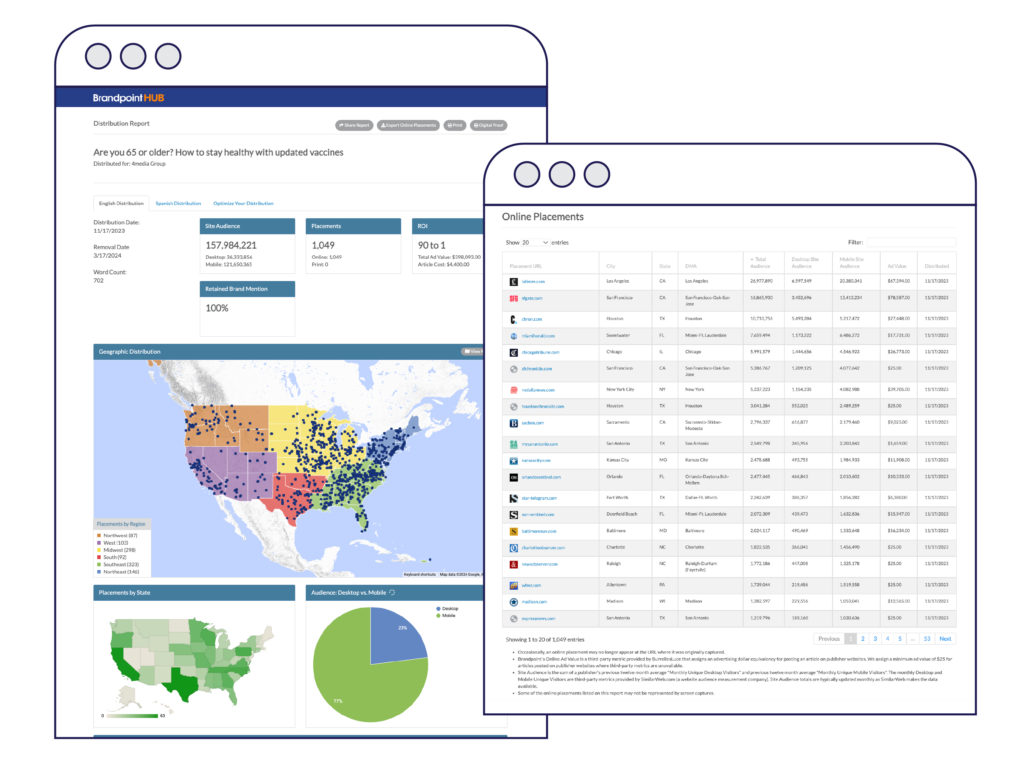
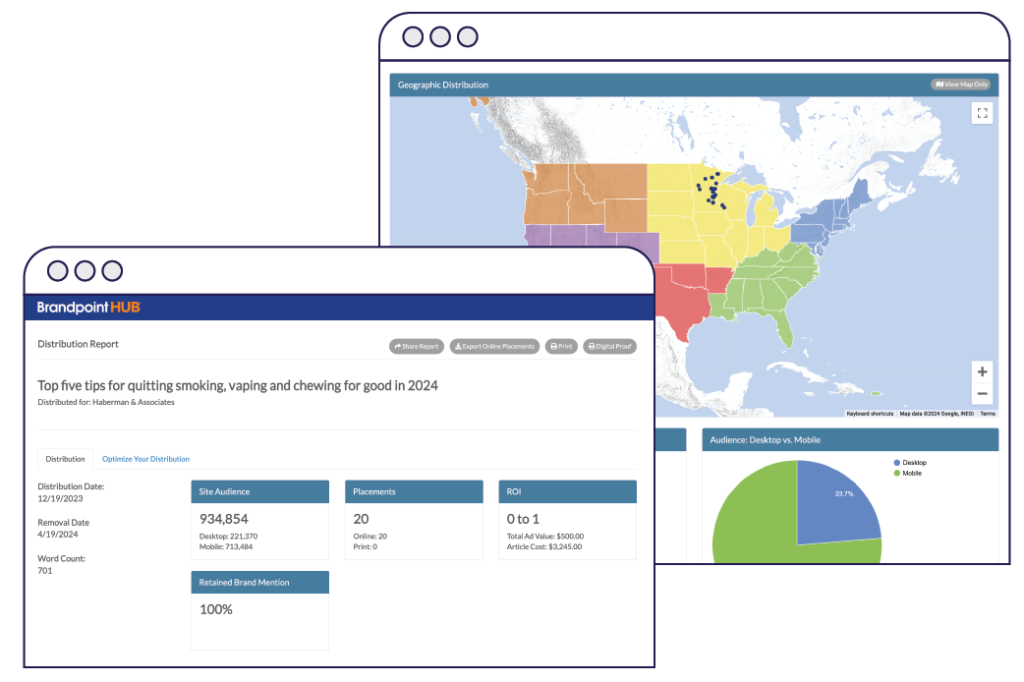
Content statistics: Title of your content, its distribution date, removal date, word count and print downloads, if applicable.
Placement metrics: Total site audience, number of placements for online and print, and the ROI you’ve earned.
Interactive distribution map: A breakdown of your placements by region, and more fun than that: each dot on the map is clickable, showing the name of the publication where your content appears and how many views it has, further broken down by the channel, either desktop or mobile.
Distribution highlights: Where our branded content was placed, how large an audience saw it, and the regions where it’s doing the best.
Online placements: A clickable list features a direct link to every publisher site where your content appears, along with info about where the publication is located, its total audience, desktop audience and mobile audience.
Print placements: If you’ve purchased print in addition to online distribution, you can see any actual clips of the article in the publication where it appears.
Campaigns with engagement and traffic add-ons will include more metrics, including:
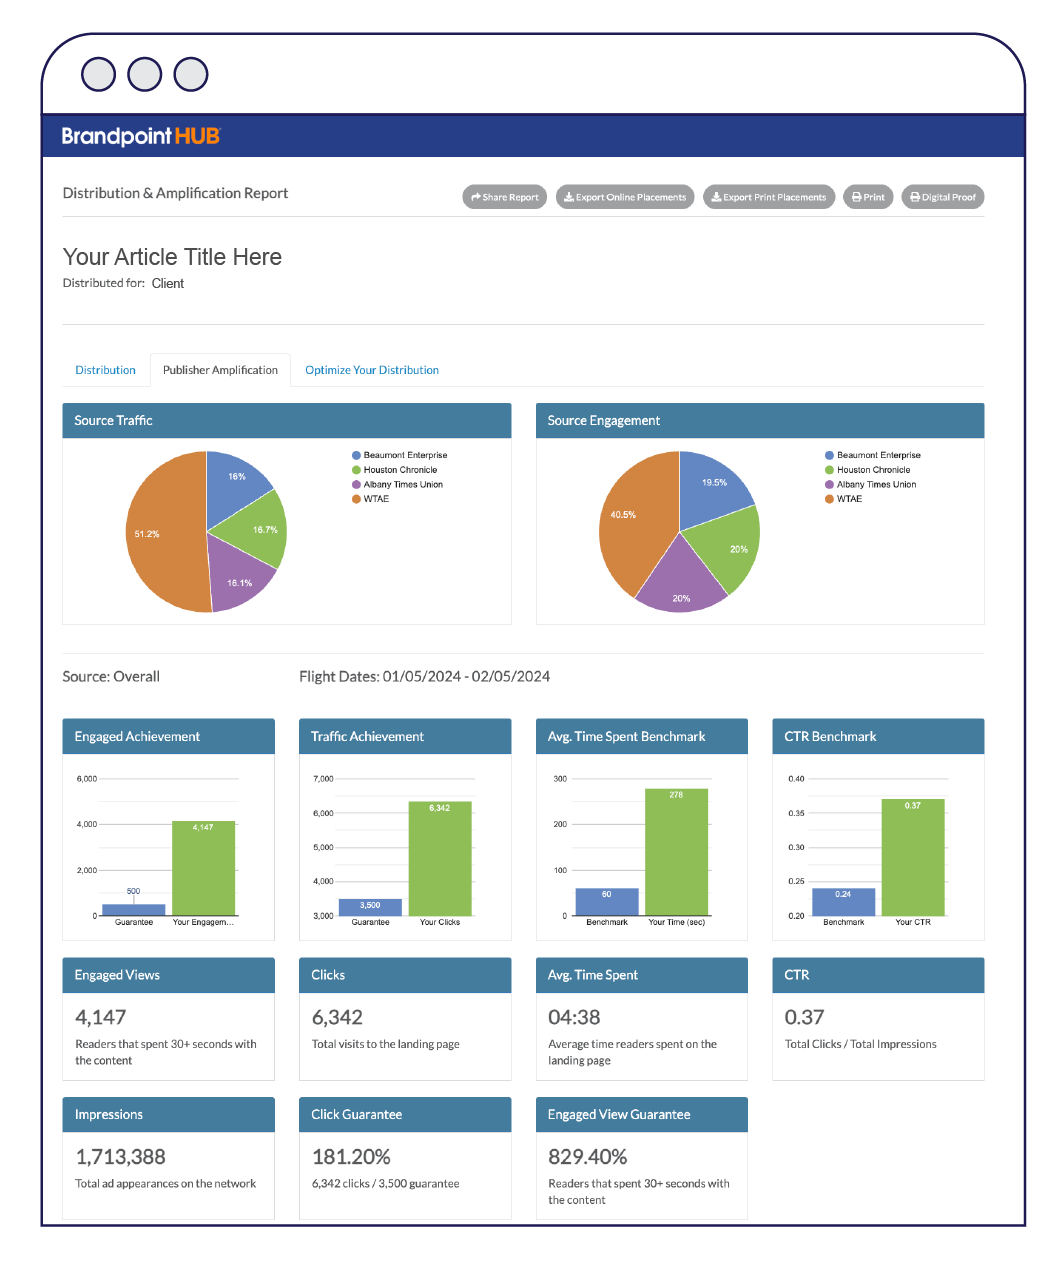
Traffic
Traffic sessions sent to the publisher site or to a brand landing page of your choosing.
CTR benchmark
This shows the benchmark and your actual click-through rate.
Clicks
The number of total visits to the landing page and the click-through rate.
Impressions
This is the total number of appearances on the network.
Click guarantee
This is the percentage of how many more clicks you’ll receive above our guarantee.
Branded content consulting
In addition to metrics, our team provides tried-and-true tactics for you to extend the already enormous reach of your brand message. It’s about what you can do to augment what we’re doing, including sharing on social media, repurposing your content into another form, posting it on your website and more.